Bicycle Reports
service :
python web app
timeline :
autumn 2020
role :
design, programming
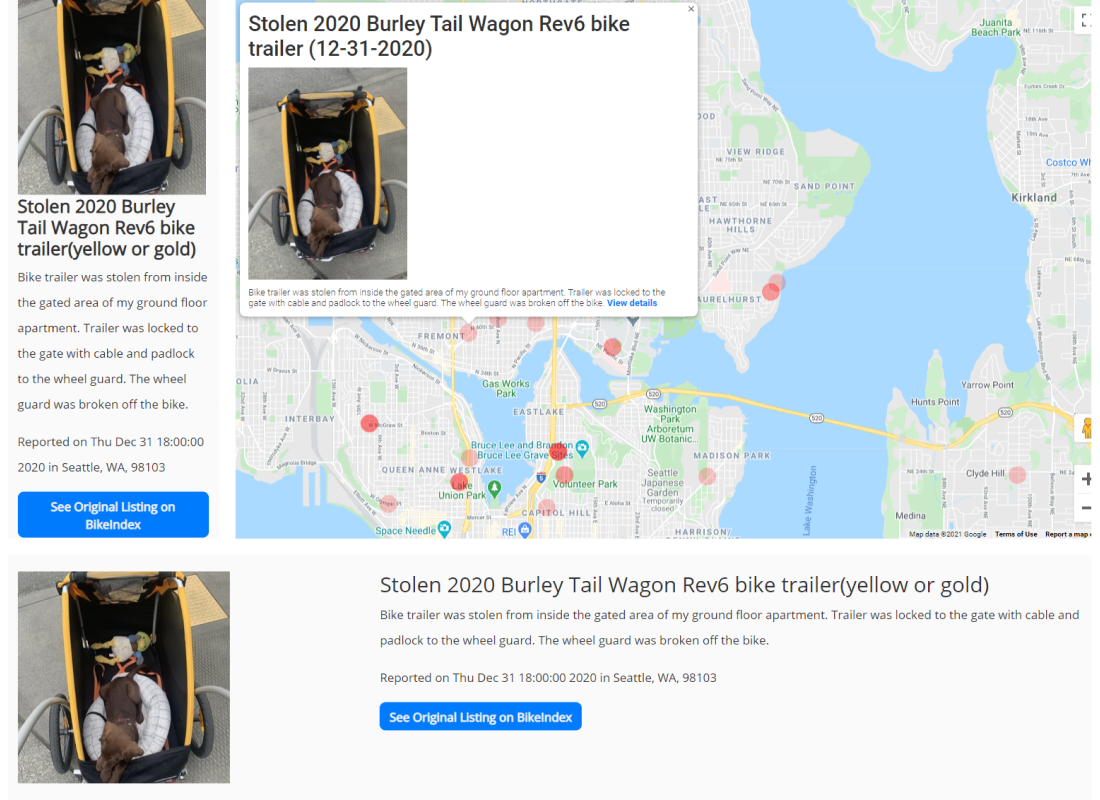
This project combines the Bikewise and Google Maps APIs in order to display bike crashes, hazards, and thefts in a given location utilizing Python, Flask, and Jinja.

PROBLEM
Over 188,500 bicycles are reported as stolen each year in the United States alone. This does not even account for the amount of bicycles unreported. The F.B.I. estimates that these stolen bicycles and parts are worth $350 million each year. Additionally, there are around 50,000 reported bicycle accidents each year, where over 10% of accidents are fatal.
PREVIEW
Map Markers
 One incident
 Three incidents within close proximity
Cards

Use Current Location

Advanced Search

Logo Creation

FEATURES
- Search for any location (name, coordinates, city, address, zip code, etc)
- View a map of incidents at any given location with card displays containing further information
- View a list of incidents with the reported title, description, image if available, and occurrence
- Search for specific terms within incident titles or descriptions
- Adjust the incident type to search for (theft, crash, hazard, unconfirmed, infrastructure issue, or chop shop)
USERS
(primary audience)
(secondary audience)
REFLECT
This project began with the mission of "adding value" to an API as I was learning Python. I also worked with Flask and Jinja, all of which were new. This was an enlightening experience where I stepped into an area of mystery and worked through challenges that arose. I'm happy to say that despite all my frustration, I became a stronger problem solver and learned to utilize my resources more effectively.
I began designing a pleasing setup to view, but had to continually iterate through multiple revisions. As I was implementing my design, I wanted to focus more on the user experience and usability rather than just the visual elements and appearance. As a result, I learned to not sacrifice the usability for aesthetics and this is a thought I will carry into my future designs. Iplan to evaluate the functionality and interactivity with the user first before polishing up visual elements.
In summary, the biggest takeaway was to not sacrifice functionality for aesthetics. While a visually appealing interface may help users become more lenient or tolerant of usability issues, I strive to avoid those altogether.